Redesigning 'YourCoach' to improve onboarding
Organisation
Atlassian
Industry
IT Service Management
Year
jan 2023 - april 2024
Role
worked under a senior designer
Background
What is your coach?
'Your Coach' is an onboarding tool designed for Jira Service Management’s self-serve customers. It serves as a critical touchpoint where users discover JSM’s capabilities and learn how to get started.
What was wrong?
Due to inconsistent information architecture, many users found Your Coach confusing and unhelpful, leading to frustration and drop-offs. As a key resource for guidance, its shortcomings left users stranded - pushing them toward competitor products.
functional onboarding rates
Only 2–4% of JSM cross-flow users
Drop off - rates & churn rates
52% of customers dropping after their first session, 70% churning within two months
from a customer
"Been a user for about decades - admin for more or less 5 yrs (Jira Cloud Core/Software). But this is my first to use and set-up JSM. Basics is easy to set-up in JSM because coming from all the schemes knowledge from Core/Software is just the same. But when you move to OTHER more next level of set-up it becomes vague, restricted options, confused and complicated…"
issues raised by
1 in 5 users
validation sample size
n = 1283, with JSM Admins or Agents who were:
At least 90 days post-purchase, and
Active in the preceding 90 days
Validating
the problem
Methods used to validate the problem
Key findings
Users found Your Coach only somewhat helpful due to confusing content and structure.
Task completion was low; users weren’t motivated or rewarded to finish all tasks.
‘Functionally onboarded’ = completing 3 key tasks;
most users only completed 1.
Competitors succeeded by using gamification and simpler onboarding.
Poor onboarding led to lost customers, especially those evaluating JSM for purchase.
Key metric for evaluation
Key Action Completion Rate
key indicator of metric
Week 2 Activation Rates (W2Wai)
How might we…
… reorganize information architecture to task completion rates?
… simplify content?
… deliver quick wins to motivate users early?
… create a personalized, rewarding onboarding journey that encourages engagement and builds momentum?
Ideation
method used to ideate
Goals of ideation
Goal 1:
Audit all tasks & make an information architecture diagram
Goal 2:
Regroup tasks to create a new information architecture & rethink content
Ideation
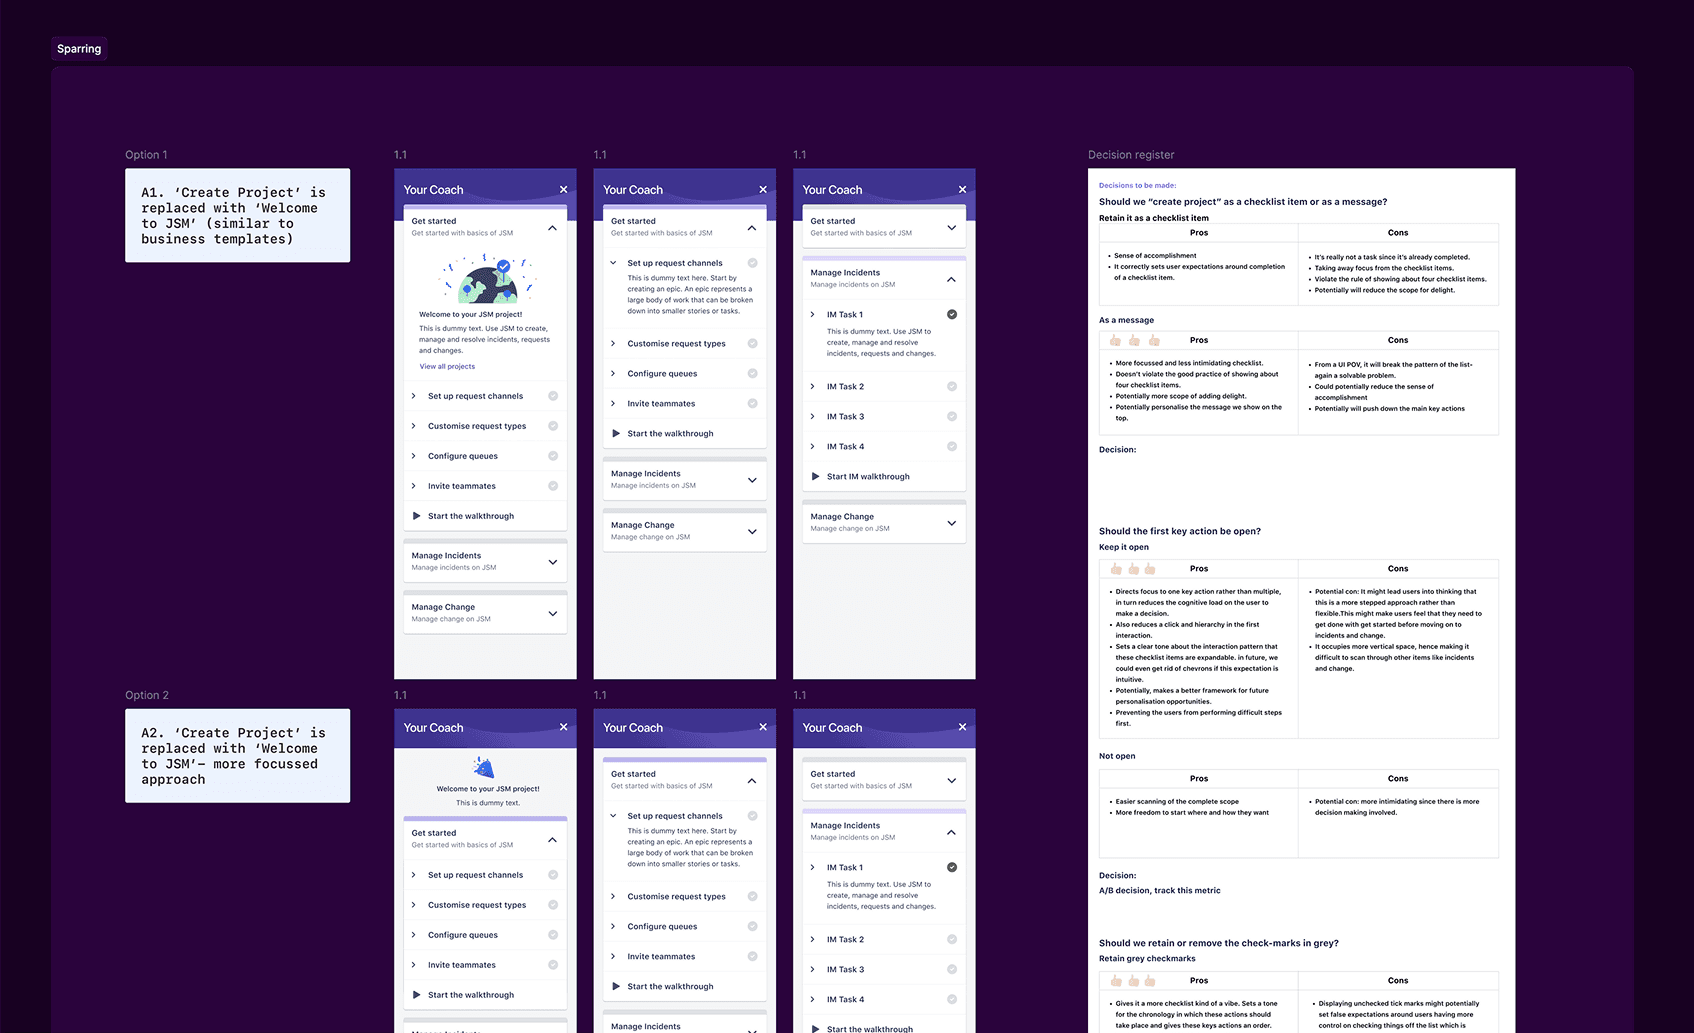
Final design direction
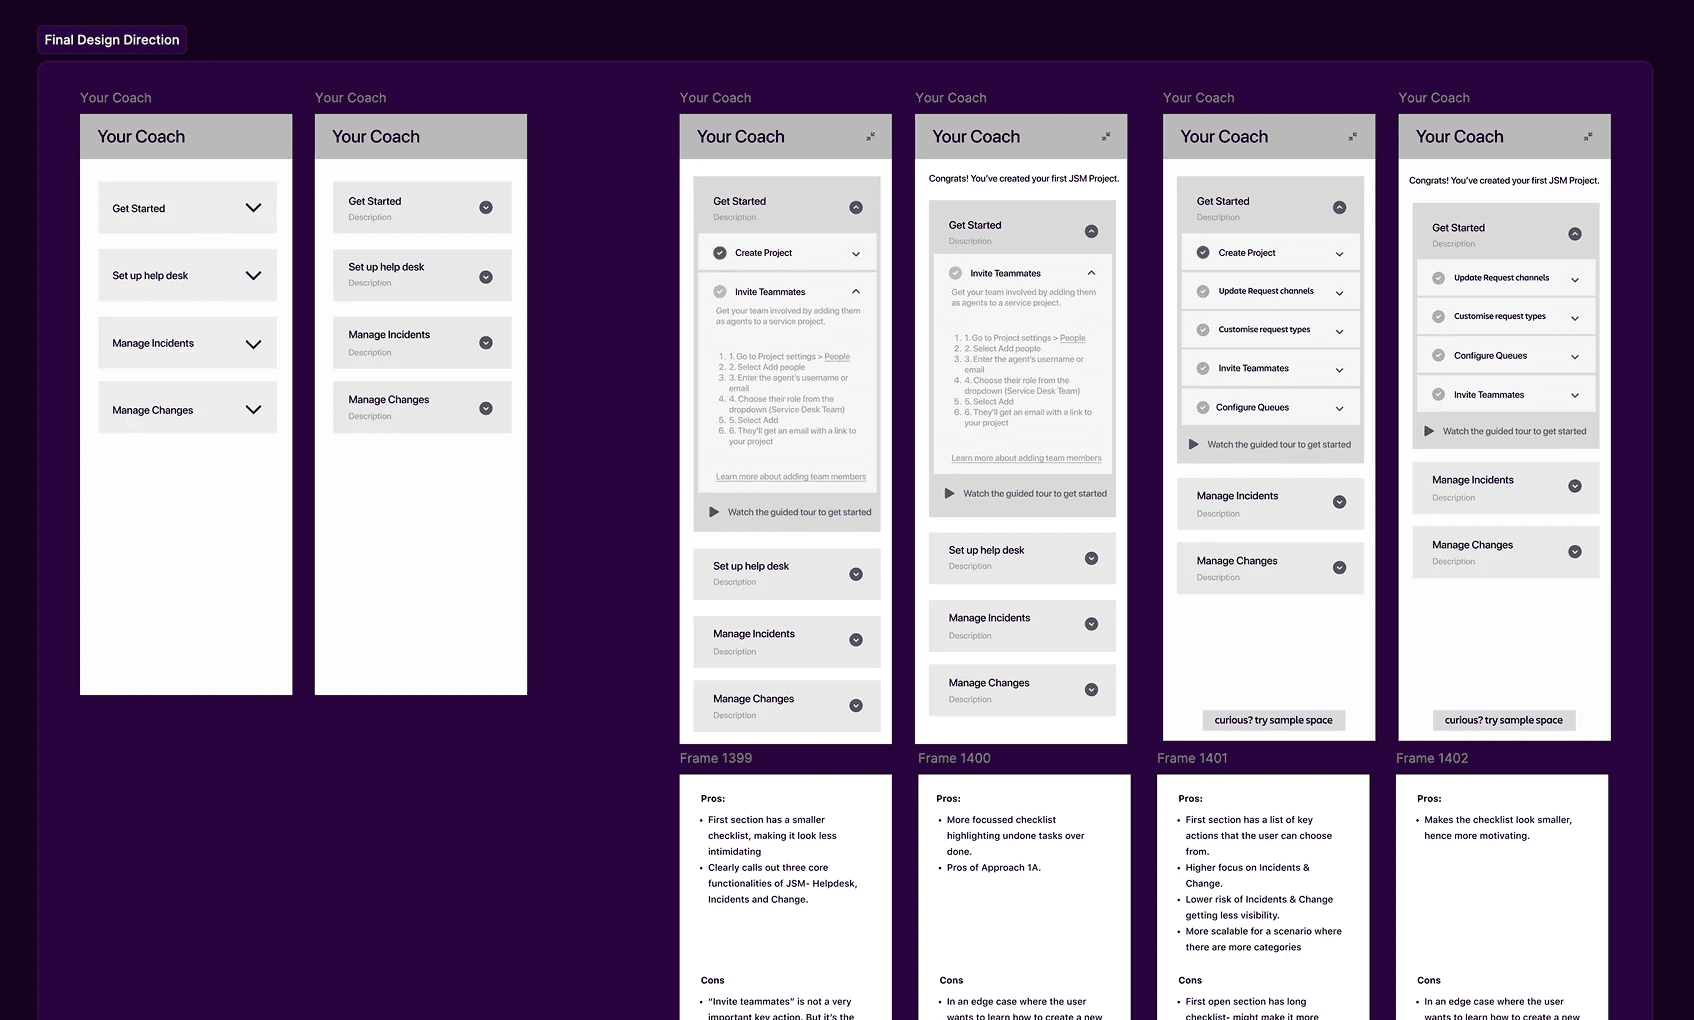
OUtcomes of the ideation session
✔️ The Sr Designer and I used paper mockups to try and test new content placement strategies.
✔️ On listing pros and cons of each, we were able to combine and decide on a final direction.
Designing
Reframed design brief
Redesign 'Your Coach' to improve user onboarding and task completion by reorganizing information architecture, simplifying task language, and clustering related actions.
target personas
design principles
Principle 1:
Use real estate conservatively. Limit number of tasks and content.
Principle 2:
Use progressive disclosure and give indicators of status.
Principle 3:
Progressively make tasks harder for users to complete. Start with quick wins.
key Information architecture decisions
Old structure had 4 sections: Quickstart, Walkthroughs, Documentation, and Sample Space.
This setup didn’t scale for modern ITSM needs like request, change, and incident management.
New structure groups tasks, walkthroughs, and documentation by work item, making it more relevant.
Sample Space is now a separate, universal section placed at the bottom.
New sections:
Work Item: Quickstart tasks, documentation, and walkthroughs
Sample Space
Before / After Experience

Toggle between different sections easily

Find & access documentation when you need it

Get visibility into task completion

Once you've set up the basics, take a tour to dive deeper

Feeling adventurous? Explore sample space whenever you're ready
Evaluation
method used to evaluate
key findings
Customers are completing more actions across newer variations, with Variation 1 outperforming Variation 2 across all key actions and completion rate with redesign increased by 36% (statistically significant)
For those who don't see Your Coach, drop-offs still remains a concern
Statistics

Impact & Learnings
Task completion rate
+36% uptick
monthly churn rates
<1%
key findings
Task completion rate with redeisgn increased by 36% (statistically significant)
Post the redesign, the annualized churn rate for JSM dropped to 7.9%, and monthly churn rates fell to below 1.0%
The redesigned version of 'Your Coach' was templatised and used by another team in Atlassian.
Learnings
Was the first project within the growth team. It being successful boosted team morale.
First project where I was in-charge of visual design decisions; this project helped me bag a promotion.